
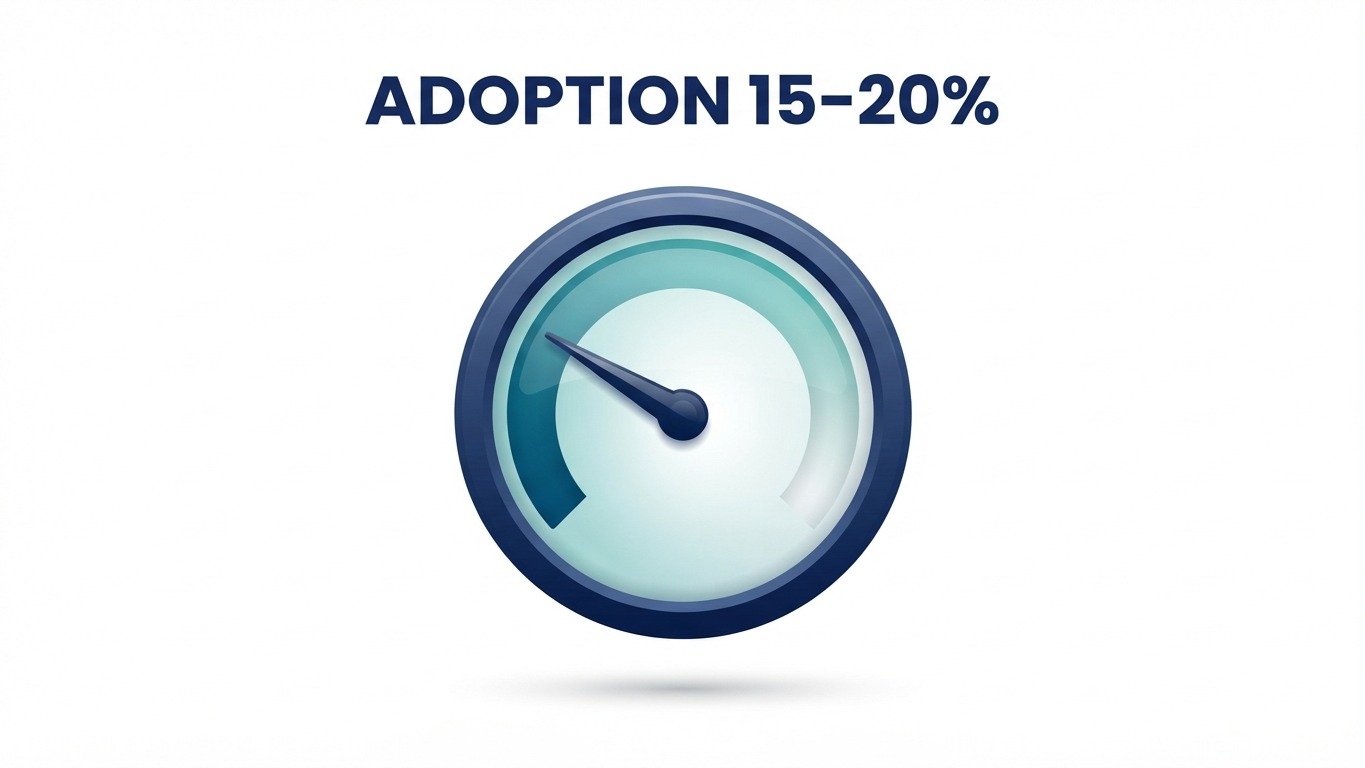
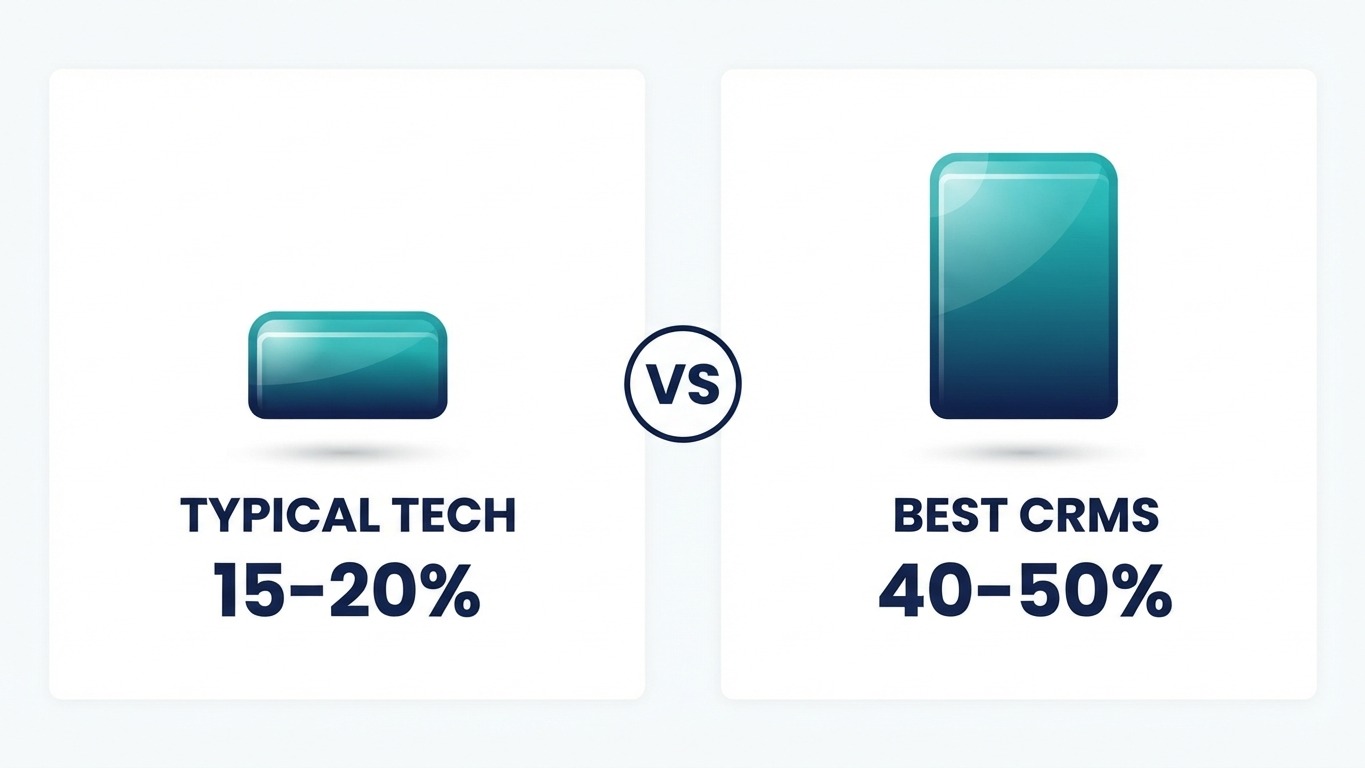
Real estate brokerage technology adoption now has a number attached, courtesy of a new T3 Sixty report. Typical adoption of brokerage-provided technology runs about 15% to 20%, while the strongest CRMs reach 40% to 50%. The report, titled “What Brokers Want From Technology Companies,” rests on 527 meetings held over several months, 140 of them with brokerage leadership. What it says about how brokers choose and judge tools matters to any agent whose brokerage is about to buy something new.

What the T3 Sixty Report Found
Real Estate News covered the report on October 5. Real Estate News is an editorially independent division of T3 Sixty, so the publisher and the report’s author are related, which is worth knowing when you read the numbers. More than 50 of the 527 meetings focused substantially on brokerage technology.
The headline figures are 15% to 20% typical adoption for technology a brokerage provides, and 40% to 50% for the strongest CRMs. The report also found that five firms in the sample have built, or are building, core platform components in-house, and three more replaced commercial products with systems assembled from general-purpose AI tools. The article names no vendors.
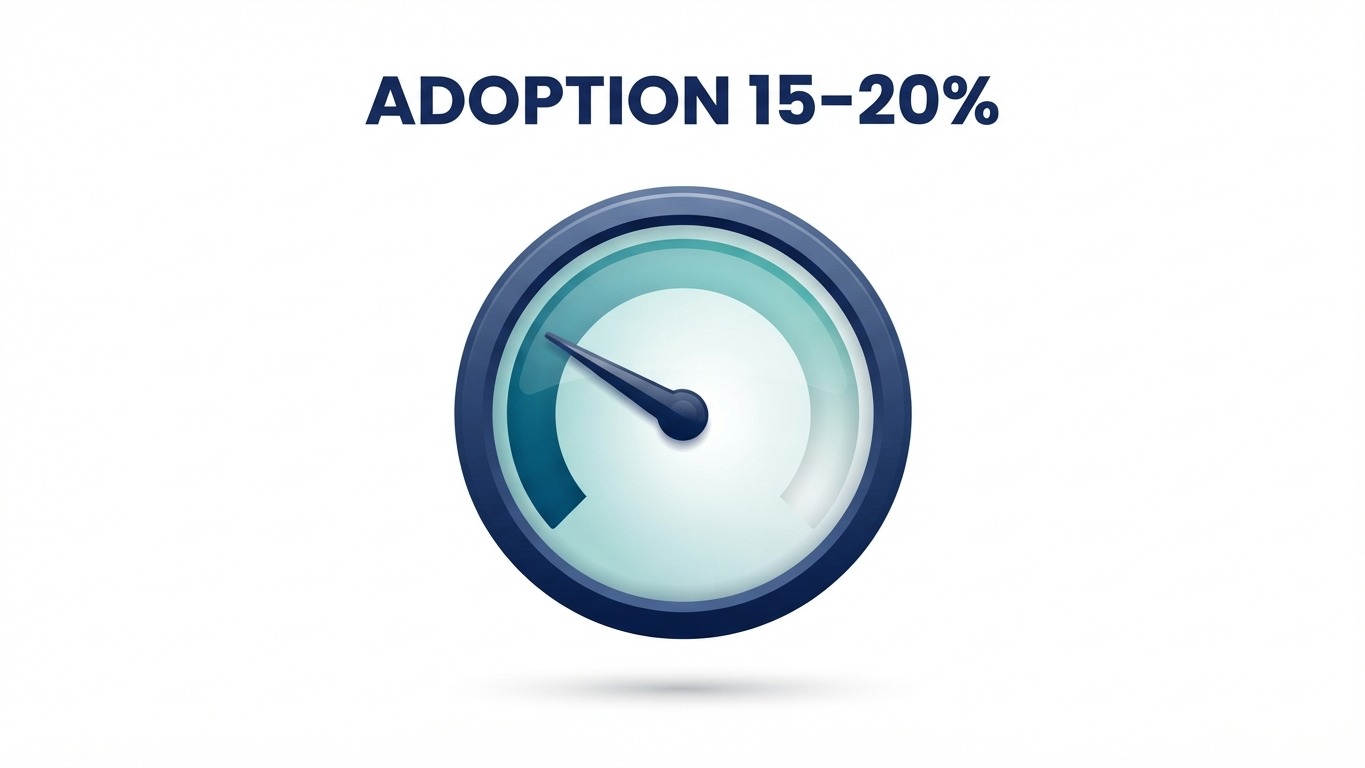
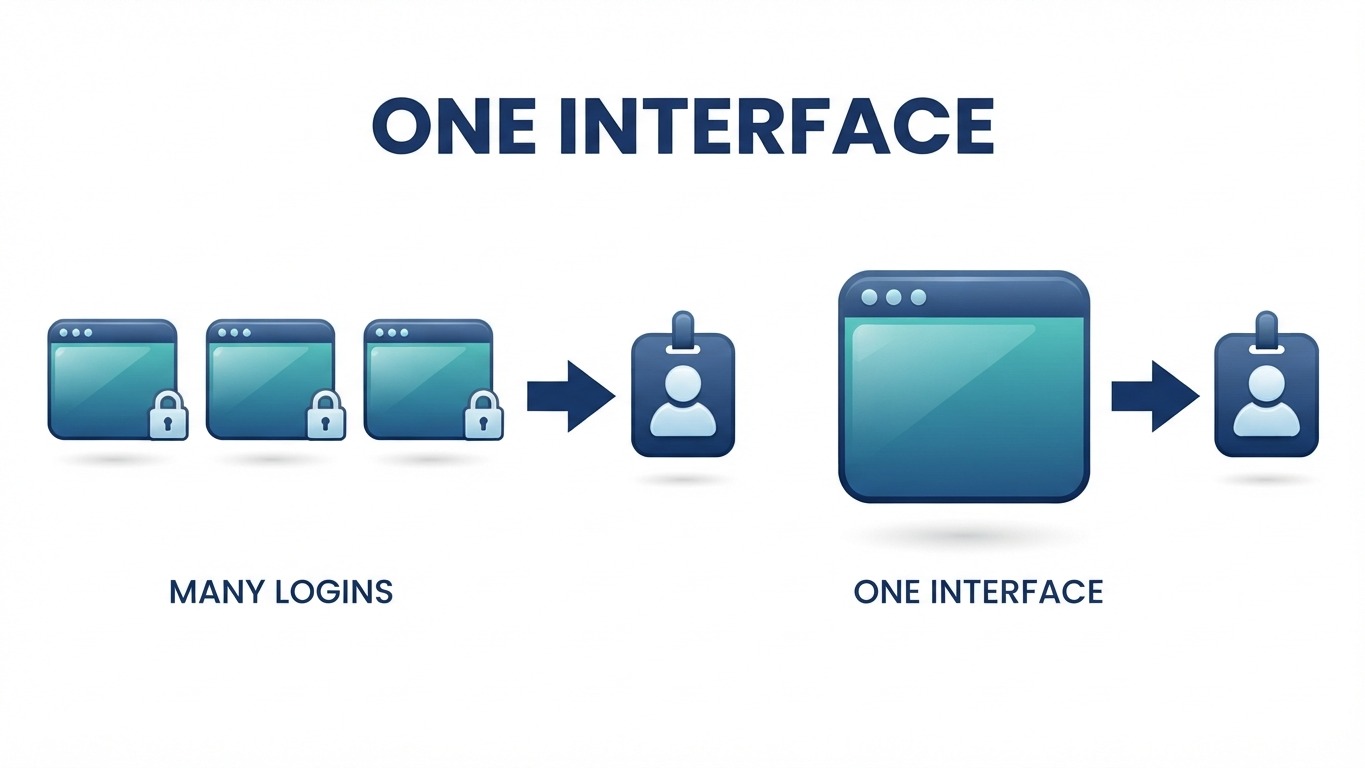
One Florida brokerage owner with 450 agents described the daily reality in plain terms: “It’s so many logins, so many different silos.” The owner said technology “is a hindrance to our business.” Derek Taylor, senior vice president of technology consulting at T3 Sixty and the report’s author, put the request simply: brokers “really do not want just a dashboard. They want one user interface.” T3 Sixty CEO Jack Miller coined the phrase “swivel chair integration” for staff who re-enter the same data across systems.
What Real Estate Brokerage Technology Adoption Data Means for Brokers
The gap between 15% to 20% and 40% to 50% is the most useful part of the report, because real estate brokerage technology adoption turns out to be a spread, not a single number. Both figures describe technology brokerages deploy, yet one group earns far higher adoption than the other. The report’s own explanation is a line worth repeating: “Adoption is the product.” A vendor has to show who actually uses a tool and whether it produces results, because a license nobody opens has no value at any price.
That matches what brokers asked for in the meetings. They want one unified interface, not only a single sign-on. They want access to their own data without restricted integrations, API fees, or legacy-version limits. They want fast answers on profitability per agent, company dollar, effective commission rates, lead conversion, and the financial impact of agent churn. One technology leader said reports pulled from several systems “take weeks to get done.”
Questions like those are what a brokerage-level platform is built to answer, a difference we covered in a CRM built for the brokerage, not the agent. The same logic applies to where a separate messaging layer earns its place. Our look at when a separate engagement layer is worth it argues that more tools only help when each owns a clear job.
What Agents Should Take From It
If your brokerage provides the tools, your own use is the data point in real estate brokerage technology adoption. Agents who open a tool every day are the adoption the report is measuring, and their feedback is what a vendor should be asked for. Tell your broker which tool you open first each morning and which one you avoid, and say why: a repeated login, a second place to enter the same contact, or a report that takes a week to build. That is the swivel chair problem in your own workflow, and it is the kind of detail a brokerage can raise with a vendor before the next renewal.
Agents who run their own business can apply the same test to personal tools. If a purchase adds a login without removing one, it will stall for the same reason brokerage tools do.
Pricing Is the Other Complaint
The report says brokers object less to cost than to how a vendor charges. Seat-based, usage-based, and measure-based models drew the most resistance, while there was more interest in pricing tied to files, transactions, or measurable outcomes. They also asked for predictable pricing. That lines up with the shift we described in why AI pricing is leaving per-user fees, where Rechat’s assistant took on more work without a price change.
Build, Buy, or Assemble From AI Tools
Five firms building in-house and three replacing commercial products with AI-assembled systems is a small sample, but it signals what some brokerages will try when adoption stays low. Miller cautioned that maintaining software is harder than building it. That is the opening the report sees for technology companies, and it is also the warning for any brokerage tempted to build. A homegrown tool still has to earn daily use, and it now needs its own support, security, and updates.
Consolidation is the other route. eXp Realty claims its Nexus platform cuts software spend by replacing a patchwork of licenses, as we noted in eXp folding its tools into one system. That is a company claim, not an independent result, but it points the same direction as the T3 Sixty findings: fewer logins, one place to work.
How to Measure Real Estate Brokerage Technology Adoption Before You Buy
Treat real estate brokerage technology adoption as a number you collect before you sign, not after. Five checks keep a purchase honest:
- Ask for adoption proof. Request the share of licensed agents who log in weekly at comparable brokerages, not the number of accounts created.
- Count the systems behind one answer. Pick a routine question such as which agents are converting leads, and count how many tools you open to answer it.
- Test data access. Ask what it costs, and what is restricted, to pull your own data out through an API or export.
- Read the pricing model. Compare per-seat charges with pricing tied to transactions or outcomes, and ask what happens to the bill if you add agents.
- Pilot with real agents. Run a 30-day trial with a mix of top producers and newer agents, then compare weekly use against the vendor’s claim.
Platforms That Aim at the Same Problem
Several platforms position themselves as the one place agents work. Follow Up Boss consolidates the inbox, routes leads by round robin, and gives team leads an accountability dashboard. Lofty bundles an IDX website, a CRM, and an AI sales agent in one platform. kvCORE gives brokerage administrators one dashboard for lead distribution, access levels, and compliance while agents work in their own portals. For a ranked comparison, see how the leading CRMs compare on daily use.
None of these guarantees real estate brokerage technology adoption. The T3 Sixty numbers suggest the deciding factor is whether agents choose to open the tool each morning, which only a trial with your own agents can show.
Final Thoughts
Real estate brokerage technology adoption of 15% to 20% means most brokerage-provided tools are not widely used, and the brokers in the report are saying why: too many logins, too many silos, and pricing that charges for access rather than results. The 40% to 50% reached by the strongest CRMs suggests the problem is not simply that agents refuse technology. Before your brokerage adds another tool, measure how much of the current stack agents use, and make the vendor prove adoption before you pay for it.
